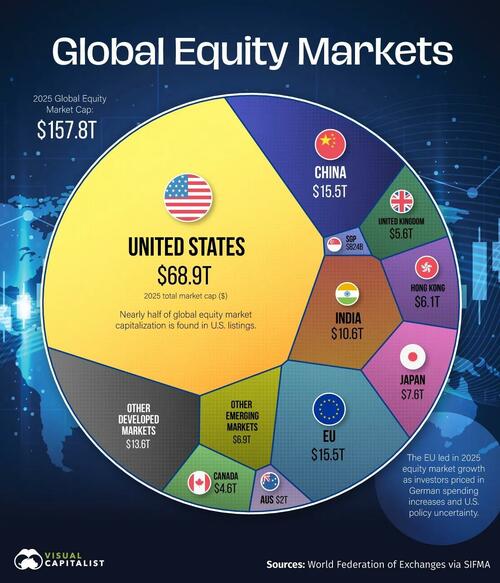
The World's $158 Trillion Stock Market In One Chart
How this call is verified
The ▲ Bullish call is auto-verified against the actual S&P 500 price in ~21h.
Our record on calls like this
1,301 scored calls here, 46.3% right (±9.0pp). Always answering up would have scored 62.3% — so we are -16.0pp.
Bar: S&P 500 ±0.3% within 24h · every verdict lands on the public ledger
AI comment — why bullish
Visualizing the global equity landscape, estimated at $158 trillion, offers a powerful perspective on interconnectedness and scale. Such a comprehensive overview can illuminate broad market implications by highlighting the dominance of certain regions and sectors, potentially signaling shifts in capital flows and investment strategies. The sheer magnitude of this figure can influence market sentiment, fostering a sense of opportunity and growth potential, or conversely, underscore the inherent risks within such a vast and complex system. This visualization connects directly to macro themes like globalization, economic development disparities, and the ongoing digital transformation, as these forces shape the composition and valuation of global stock markets. Ultimately, understanding the sheer size and distribution of global equities can affect investor confidence, encouraging a more informed approach to risk appetite by providing context for individual investment decisions within a much larger financial ecosystem.
Key takeaway
"The World's $158 Trillion Stock Market In One Chart" — BullBear's AI rates this story as a bullish (positive) signal for markets, with a market-impact score of 70 out of 100. Visualizing the global equity landscape, estimated at $158 trillion, offers a powerful perspective on interconnectedness and scale. Such a comprehensive overview can illuminate broad market implications by highlighting the dominance of certain regions and sectors, potentially signaling shifts in capital flows and investment strategies. The sheer magnitude of this figure can influence market sentiment, fostering a sense of opportunity and growth potential, or conversely, underscore the inherent risks within such a vast and complex system. This visualization connects directly to macro themes like globalization, economic development disparities, and the ongoing digital transformation, as these forces shape the composition and valuation of global stock markets. Ultimately, understanding the sheer size and distribution of global equities can affect investor confidence, encouraging a more informed approach to risk appetite by providing context for individual investment decisions within a much larger financial ecosystem. That score reflects how strongly the story is likely to move Bitcoin, US equities, the dollar, and gold, and near-duplicate coverage of the same event is clustered so only the representative article is scored. Reported by ZeroHedge on August 28, 2026. The call is verified against the actual 24-hour price move on BullBear's public conviction ledger.
Catch the next bull catalyst
Telegram alerts when our AI scores a story 80+/100 impact (~1-3 per day, no spam). Verified 30d hit rate 41.5%.