Where It's Hardest To Afford A Home
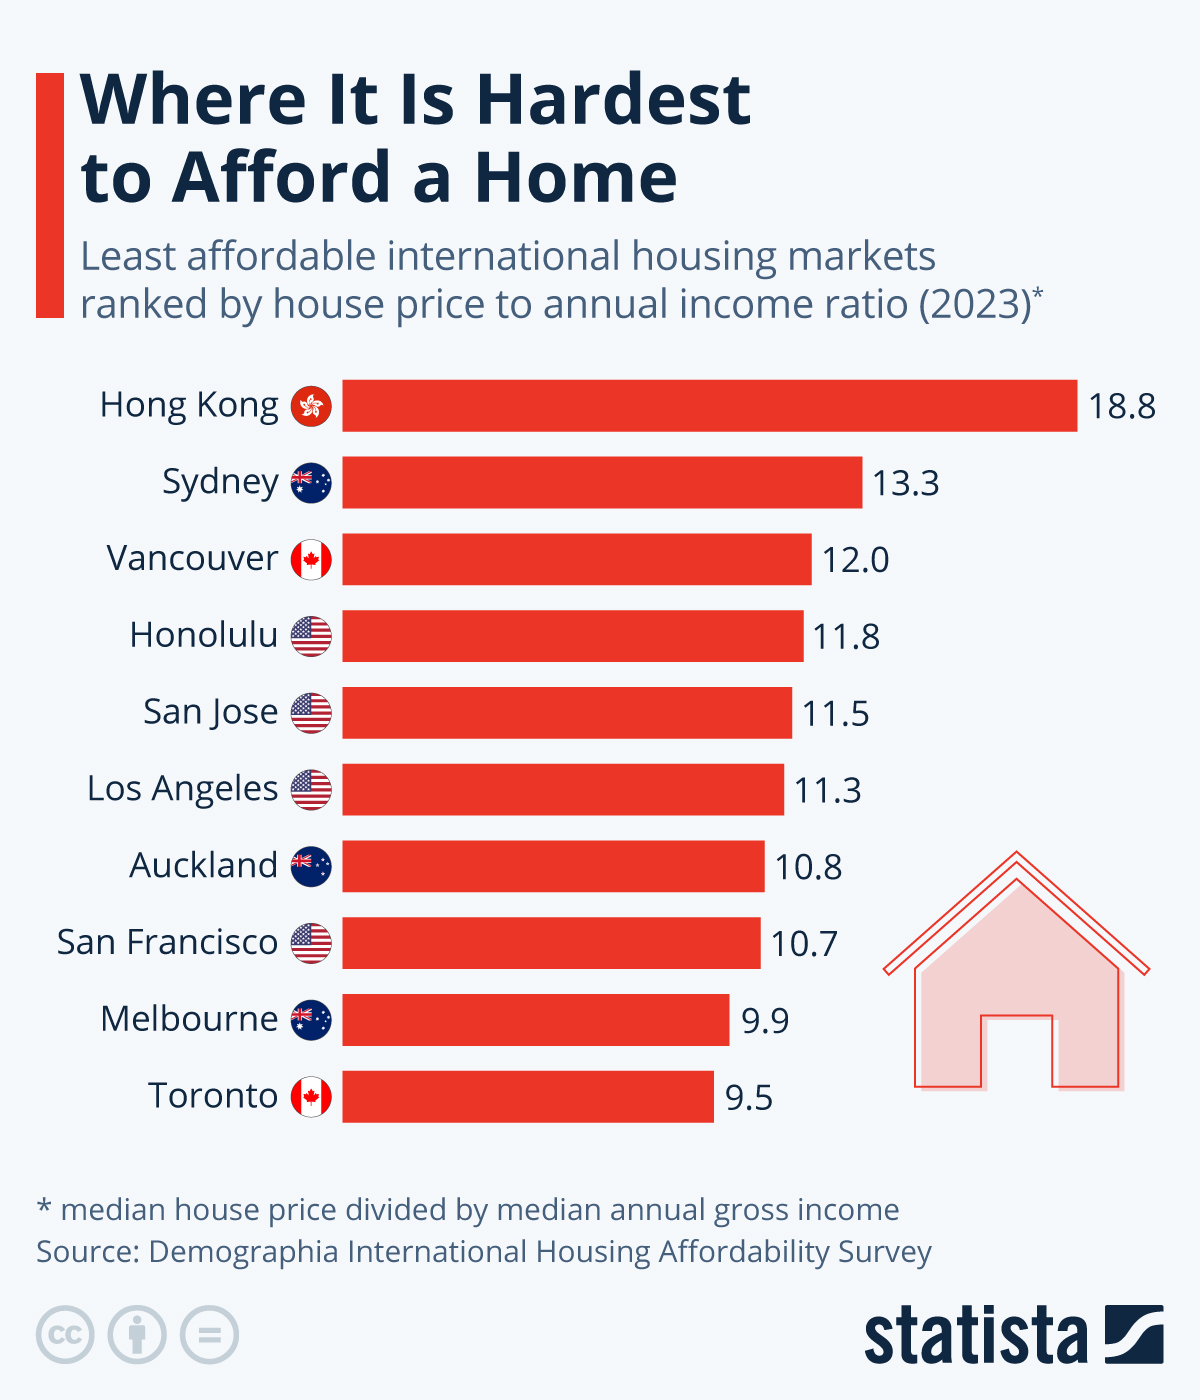
Where It's Hardest To Afford A Home Big cities like Hong Kong or Los Angeles are well-known for their expensive real estate markets. But there are also plenty of housing markets you wouldn’t necessarily expect among the least affordable – including several in Australia, New Zealand and Canada. As Statista's Tristan Gaudiaut details below, according to a 2026 ranking by Forbes, Hong Kong remains the world’s least affordable housing market, with median home prices still more than 16 times higher than median pre-tax household incomes, based on the dominant housing type in each market. You will find more infographics at Statista It is followed by Sydney (13.8) and Vancouver (11.8), while several U.S. cities, including San Jose (11.4), Los Angeles (10.9) and Honolulu (10.5), also rank among the least affordable. The first
Key takeaway
"Where It's Hardest To Afford A Home" — BullBear's AI rates this story as a mixed, direction-neutral signal, with a market-impact score of 0 out of 100. Where It's Hardest To Afford A Home Big cities like Hong Kong or Los Angeles are well-known for their expensive real estate markets. But there are also plenty of housing markets you wouldn’t necessarily expect among the least affordable – including several in Australia, New Zealand and Canada. As Statista's Tristan Gaudiaut details below, according to a 2026 ranking by Forbes, Hong Kong remains the world’s least affordable housing market, with median home prices still more than 16 times higher than median pre-tax household incomes, based on the dominant housing type in each market. You will find more infographics at Statista It is followed by Sydney (13.8) and Vancouver (11.8), while several U.S. cities, including San Jose (11.4), Los Angeles (10.9) and Honolulu (10.5), also rank among the least affordable. The first Reported by ZeroHedge on June 06, 2026. The call is verified against the actual 24-hour price move on BullBear's public conviction ledger.
Get the next high-impact catalyst
Telegram alerts when our AI scores a story 80+/100 impact (~1-3 per day, no spam). Verified 30d hit rate 53.3%.